Four early 2026 SaaS trends

SaaS valuations hit decade-plus lows in Q1 2026 as markets priced in AI as an existential threat. But the picture is more nuanced than the headline numbers suggest. Growth-adjusted multiples reveal potential lingering vulnerability, operating margins show a maturing industry, and our AI-weighted index suggests the market is painting all SaaS companies with the same brush rather than distinguishing potential winners from losers. Below, we present four metrics to more fully illuminate current trends.
1. The SCI Annual Recurring Revenue multiple
The median annual recurring revenue (ARR) multiple for the SaaS Capital Index (SCI) is a key metric for the broad health and attractiveness of the SaaS business model. After its sharp decline from Covid-era excesses, the multiple was range-bound from late 2022 through late 2025. At the beginning of 2026, growing concern that AI posed an existential risk to the SaaS business model catalyzed a sharp re-rating lower. The ARR multiple now sits at decade-plus lows – a reflection of current sentiment toward SaaS. Going forward, a stabilization or increase in the multiple would go a long way in signaling the market is moving away from the indiscriminate AI-as-existential-threat narrative.
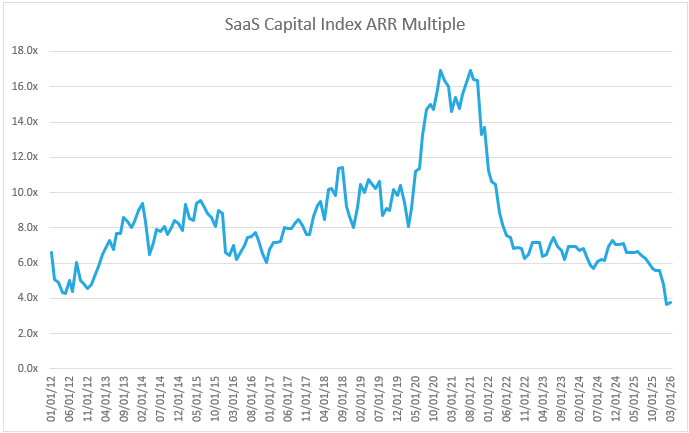
It is also important to recognize that the operating fundamentals of public SaaS companies have changed as the industry matures. A given valuation multiple is not “purchasing” the same level and mix of growth or profitability today as it did 5 years ago. Any analysis of the industry should complement the ARR multiple with other metrics, one of which we present below.
2. The ARRG Multiple (or the SaaS equivalent of the PEG ratio)
The PEG ratio (Price-to-Earnings ratio divided by growth rate) adjusts valuations for growth rates. Two companies sporting PE ratios of 25 may appear similarly valued, however, if one is growing at 25% and the other at 5%, what an investor is actually purchasing (all else equal) is quite different.
We took the idea behind the PEG ratio and applied it to the SCI ARR multiple: dividing the median multiple by the median year-on-year growth rate in the SCI (what we will call the ARRG multiple). We believe this valuation metric will be an increasingly valuable component to analyze.
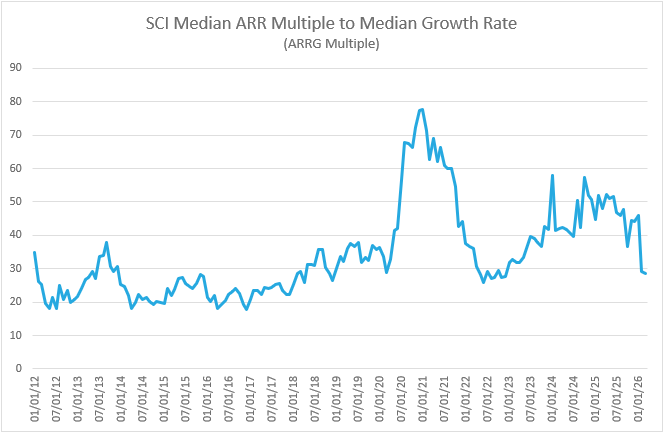
Since a local peak in 2021 at 30%+, the SCI median growth rate steadily declined to the low teens. Consequently, while the ARR multiple fluctuated in a range between 2022 and 2025, the ARRG multiple steadily increased over this period. Effectively, investors were paying more for a given level of growth. This may have contributed to the industry’s valuation vulnerability in the first quarter when AI risk led to a broad-based questioning of future growth.
While the ARRG multiple declined sharply in the Q1 SaaS sell-off, it is still above prior lows, suggesting there may be further vulnerability to SaaS valuations, especially if growth rates continue to decelerate.
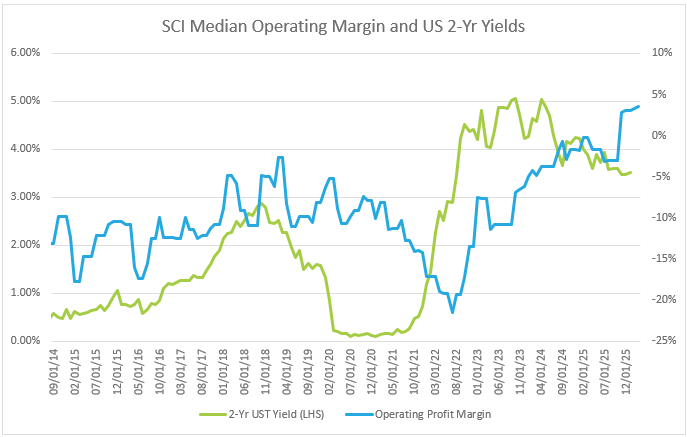
3. SaaS Operating Margins
Multiples and growth may be declining, but SaaS companies are not standing still. As we wrote previously, SaaS companies executed a remarkable turnaround in operating margin over the past three years. For the first time in more than a decade, the median public SaaS company has an operating profit.
Trend changes in operating profits line up well with sustained moves in interest rates. Tracking how operating margins evolve from here should provide a key insight as to whether the industry will return to prioritizing growth or if we have moved into a different stage for public SaaS companies and their operating priorities.

4. The AI-Weighted SaaS Capital Index
SaaS Capital recently published a framework for assessing AI risk to SaaS companies. We then ranked each constituent in the SCI according to the framework.
Curious to see if the public market agreed with our assessment, we constructed an AI-weighted SCI index (AISCI) in which each constituent is weighted by their respective AI score. The graph below charts the difference in stock performance between a basket of the top-ranked SCI constituents by AI score compared to a basket of the lowest-ranked constituents. Both baskets are indexed to 100 as of November 2022, when the launch of ChatGPT brought AI firmly into the public consciousness.
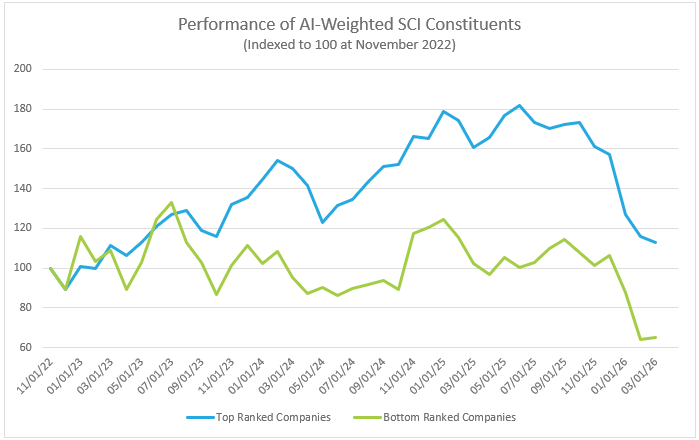
The basket of top-ranked companies materially outperformed the lowest-ranked basket through 3Q 2025. This would seem to support our thesis that AI will have disparate impacts on SaaS companies, leaving some in better positions while severely weakening, if not obsoleting, others. However, as anxiety related to AI risks reached a fevered pitch in Q1 2026, both baskets declined in near lockstep.
Tracking the relative performance of these baskets going forward should provide a signal for whether the market is adopting an existential or idiosyncratic risk interpretation of AI’s impact on the SaaS industry.
![]()

